Software
Visualization software for 3D galactic magnetic field and matter distribution models (D4.3)
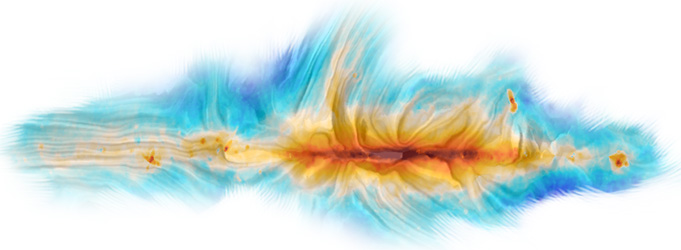
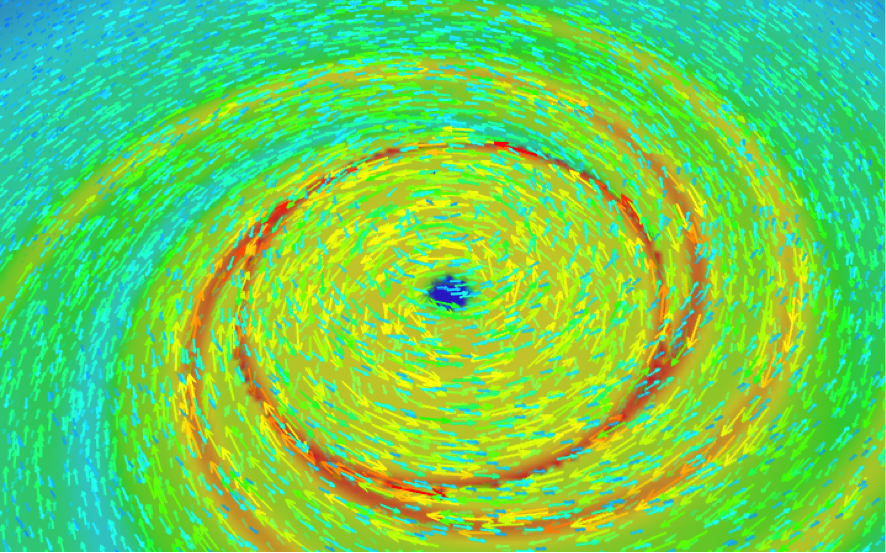 As part of the RADIOFOREGROUNDS project, and to provide user tools for our data products, we provide a python open source code (show_gridded_Bfield.py) to visualize 3D volumetric data for magnetic field models of the galaxy in an easy interactive way.
Download
The code can be downloaded from here, or from this GitHub link. Check GitHub site for the very latest up-to-date version.
Installation
The script make use of the MayaVi Data Visualizer, that is free and distributed under the conditions of the BSD license and is a python library interface to the Visualization Toolkit (VTK) for the graphics. It is therefore cross platform and should run on most UNIX/Linux, Mac OSX and Windows where python and VTK are available. It should be possible to load via the package manager for most of the popular Linux distributions, by finding Mayavi2 or Mayavi and installing along with dependences.
API interface
Command line args:
- filename : The B-field file is a long stream of binary double precision numbers with no formatting produced by simulation pipeline covering the whole or part of the galaxy.
- --shape=nx,ny,nz : The shape of the array must given via the 'shape' command line option or it is assumed to be a default (256,256,51)
- --hslice : Whether or not to show a semitransparent horizontal slice showing the B-field intensity.
- --axes : Shows x, y and z axes with the extent in terms of cells.
- --colorbar : Shows the colour scale for the B-field magnitude (in μG)
- --mask_points=100 : Thinning factor. Default of showing 1 in 100 seems to work best.
scale_factor=3 : Scale size to apply to arrows. Default=3.
History
- Version 1. Released in June 2017.